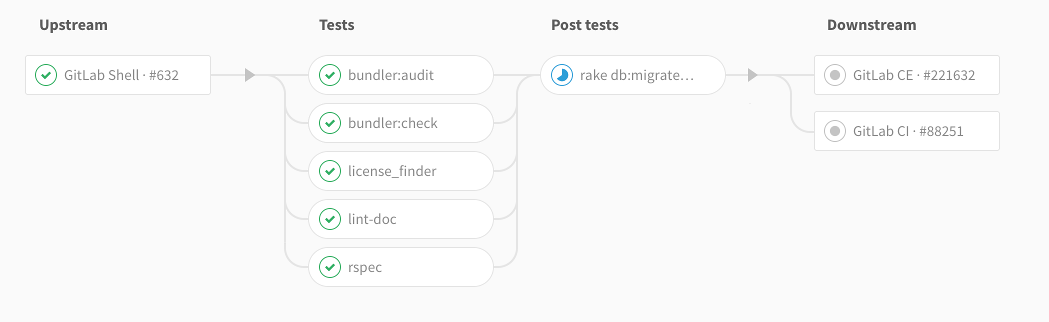
Multi-project pipeline graphs
When you set up GitLab CI/CD across multiple projects, you can visualize the entire pipeline, including all multi-project stages.
Overview
GitLab CI/CD is a powerful continuous integration tool built-in GitLab. GitLab CI works not only per project, but also across projects. When you configure GitLab CI for your project, you can visualize the stages of your jobs on a chart called pipeline graph.
In the Merge Request Widget, multi-project pipeline mini-graps are displayed, and when hovering or clicking (mobile) they will expand and be shown next to each other.

Multi-project pipeline graphs are useful for larger projects, especially those adopting a microservices architecture, that often have a set of interdependent components which form the complete product.
Use cases
Let's assume you deploy your web app from different projects in GitLab:
- One for the free version, which has its own pipeline that builds and tests your app
- One for the paid version add-ons, which also pass through builds and tests
- One for the documentation, which also builds, tests, and deploys with an SSG
With Multi-Project Pipeline Graphs, you can visualize the entire pipeline in a beautiful and clear chart, including all stages of builds and tests for the three projects.
How it works
Using the CI_JOB_TOKEN when triggering pipelines, GitLab
recognizes the source of the job token, and thus internally ties these pipelines
together which makes it easy to start visualizing their relationships.
Those relationships are displayed in the pipeline graph by showing inbound and outbound connections for upstream and downstream pipeline dependencies.